Is the Number of Homes for Sale Finally Growing?
An important metric in today’s residential real estate market is the number of homes available for sale. The shortage of available housing inventory is the major reason for the double-digit price appreciation we’ve seen in each of the last two years. It’s the reason many would-be purchasers are frustrated with the bidding wars over the homes that are available. However, signs of relief are finally appearing.
According to data from realtor.com, active listings have increased over the last four months. They define active listings as:
“The active listing count tracks the number of for sale properties on the market, excluding pending listings where a pending status is available. This is a snapshot measure of how many active listings can be expected on any given day of the specified month.”
What normally happens throughout the year?
Historically, housing inventory increases throughout the summer months, starts to tail off in the fall, and then drops significantly over the winter. The graph below shows this trend along with the month active listings peaked in 2017, 2018, and 2019.
What happened last year?
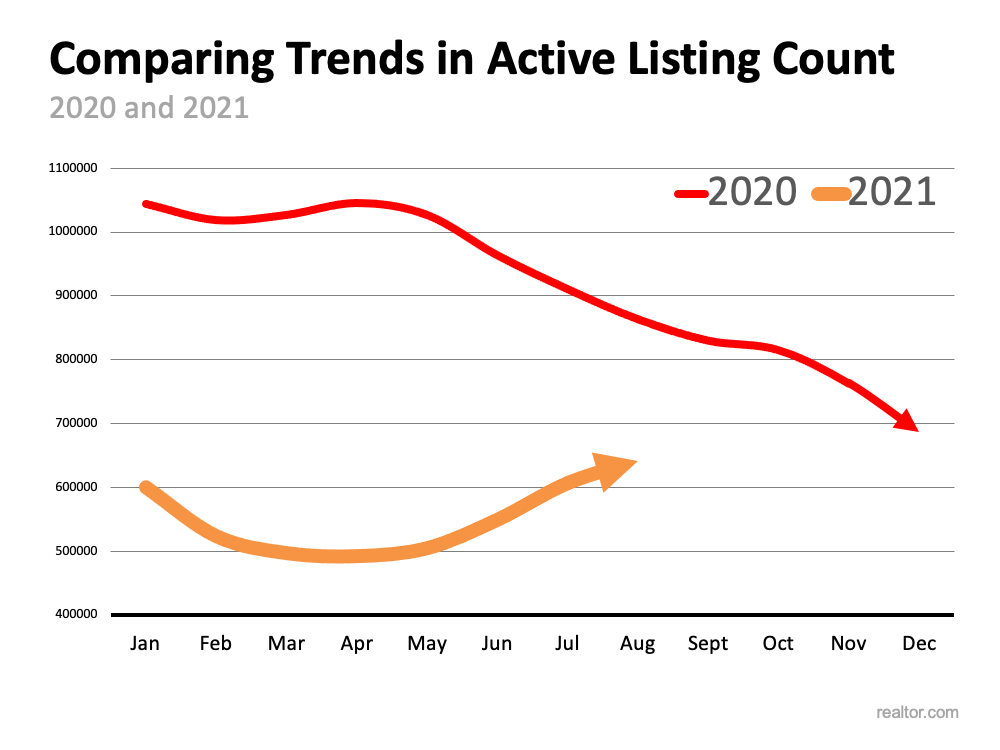
Last year, the trend was different. Historical seasonality wasn’t repeated in 2020 since many homeowners held off on putting their houses up for sale because of the pandemic (see graph below). In 2020, active listings peaked in April, and then fell off dramatically for the remainder of the year.
What’s happening this year?
Due to the decline of active listings in 2020, 2021 began with record-low housing inventory counts. However, we’ve been building inventory over the last several months as more listings come to the market (see graph below): There are three main reasons we may see listings continue to increase throughout this fall and into the winter.
- Pent-up selling demand – Homeowners may be more comfortable putting their homes on the market as more and more Americans get vaccinated.
- New construction is starting to take off – Though new construction is not included in the realtor.com numbers, as more new homes are built, there will be more options for current homeowners to consider when they sell. The lack of options has slowed many potential sellers in the past.
- The end of forbearance will create some new listings – Most experts believe the end of the forbearance program will not lead to a wave of foreclosures for several reasons. The main reason is the level of equity homeowners currently have in their homes. Many homeowners will be able to sell their homes instead of going to foreclosure, which will lead to some additional listings on the market.
Bottom Line
If you’re in the market to buy a home, stick with it. There are new listings becoming available every day. If you’re thinking of selling your house, you may want to list your home before this additional competition comes to market.


